The US national graduation rate is 84.1%. However, it is estimated that a “90 percent high school graduation rate would likely create more than 65,000 new jobs and boost gross domestic product by $11.5 billion annually.”[1] Certainly a worthy goal and one that would compound for each graduating class.
Currently only two states, Iowa and New Jersey have a 90% high school graduation rate.[2] The big question for this research became: could a model be developed to predict graduation rates and could the model’s variables be changed to predict a 90% graduation rate for individual high schools.
The Data
The Department of Education graduation data provides Adjusted Cohort Graduation Rates (ACGR) for 23,090 high schools. The four year ACGR is the number of students who graduate in four years or less with a regular high school diploma divided by the number of students who formed the cohort for that graduating class, starting in 9th grade. However, to protect student privacy, if there are less than 5 students in the cohort, no data is provided and for cohorts less than 200, a range is given. The smaller the cohort the wider the range will be. When a range is given, this research assumed the average number of the range.
The Office for Civil Rights (OCR) data has 1,836 variables including bullying, teacher-student ratio, certification, absenteeism, sports participation, and more divided by gender, ethnicity, LEP, and 504 subsets.
The Model

95% Confidence Intervals of several variables that influence US high school graduation rates.
Of the many different variables, 12 were chosen to measure their correlation with graduation rates. On the chart, the 95% confidence intervals are plotted. If the 95% confidence interval includes the zero dotted line, one can assume with 95% confidence that the variable has zero influence on graduation rates. Three variables included zero, teacher/student ratio, harassment/bully allegation ratio, biology class enrollment. Three other variables were very close to zero, but did not include it, teacher absenteeism, in-school suspension rate, and money per student spent on activities. Of the remaining six, this research choose to focus on three variables, chronic absenteeism and AP class participation most strongly influenced graduation and sports participation also seems to be an important positive influence on graduation rates.
Model Prediction
If a school principal or district is to use the model, it must be a simple model. Complicated models are hard to remember and focus on, simple models can be implemented. Rather than use all six variables, this research focused on three that had significant influence. The model shows the result below with several related metrics. 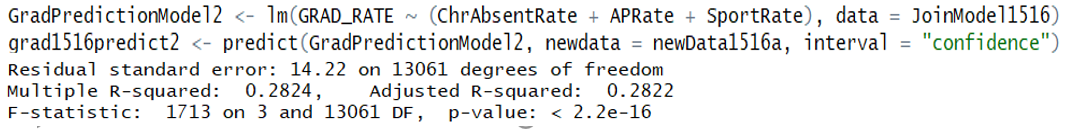
In order to test the model, three high schools were chosen that had less than 90% graduation. John F. Kennedy High School was chosen as it one of the lower performing high schools in Montgomery County, Maryland, a wealthy suburb of Washington, DC. H.D. Woodson High School in Washington, DC has previously been identified as a high school with an improving graduation rate in the District of Columbia Public Schools system, which has historically low graduation rates. South Lakes High School is a graduation rate similar to the Virginia state rate. The three high schools also have different enrollments, John F. Kennedy High School has about 1,500 students; H.D. Woodson has about 775 students and South Lakes High School has about 2,400 students.
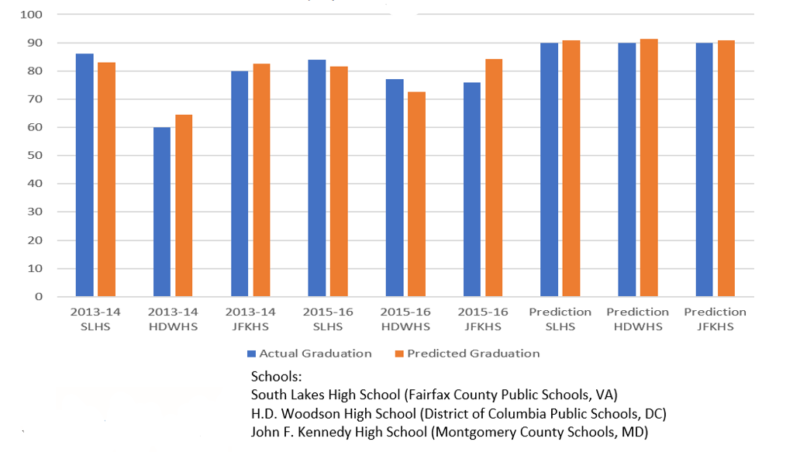
Predicted vs. Actual Graduation Rates for three high schools, South Lakes High School, H.D. Woodson High School, and John F. Kennedy High School.
The chart shows the predicted graduation rate using the model and the actual graduation rate as reported by the Department of Education. The last three columns show if a 90% prediction rate was possible and how close it could be to 90%.
90% Prediction
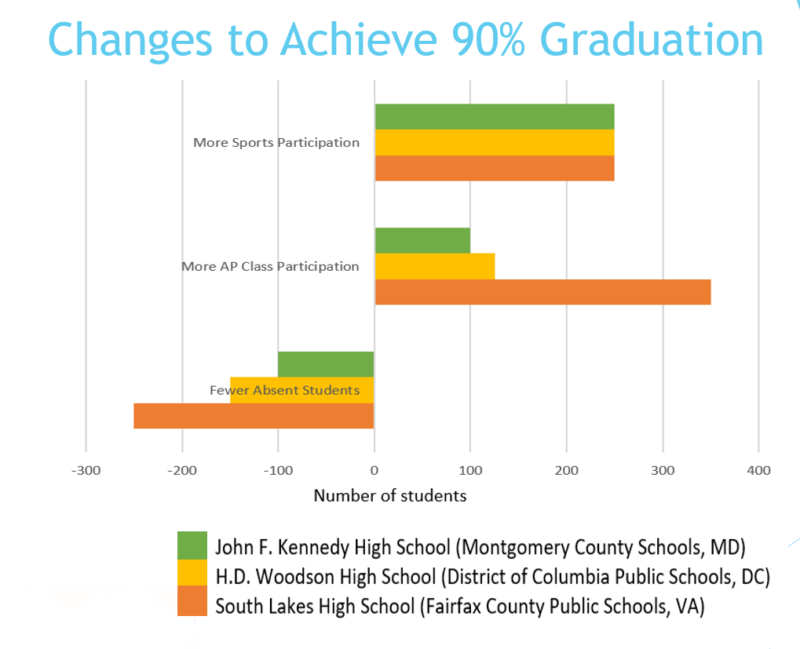
Changes Necessary to Achieve 90% Graduation . Estimates for three high schools
This chart shows what a specific school would have to change to achieve a predicted 90% graduation rate. All of them would have to increase of students that participate in a high school sport by 250 students. They would all have to increase the number of students taking AP classes. All the schools would have to make a greater effort to reduce chronic absenteeism among their student populations. However, the good news is that all these changes are possible and within the range what could be expected over the next three years, if school administrators and leaders devoted the time, money and energy to the effort.
Links to the data:
https://www2.ed.gov/about/inits/ed/edfacts/data-files/acgr-sch-sy2013-14.csv
https://www2.ed.gov/about/inits/ed/edfacts/data-files/acgr-sch-sy2015-16.csv
https://www2.ed.gov/about/offices/list/ocr/docs/crdc-2013-14.html
https://www2.ed.gov/about/offices/list/ocr/docs/crdc-2015-16.html
I am surprised that only 2 states have a 90% graduation rate. What are the school boards doing in Iowa and NJ differently from the rest? I would have thought the graduation rate would have been better in many other northern states as well.
Thank you for your thoughts. I do not know what Iowa and New Jersey do to achieve 90% graduation. I will look into it for a future blog.
I hate to say this but due to what is politically going on right now, the ones who have the highest risk of dropping out are kids of democratic parents. Their attitudes are that they can get a free ride from the system. So their attitude towards graduating, going to college, and getting jobs are flawed.
Thank you for your comments I have not seen any studies in the past showing an association between parent’s politics and graduation.
I have been following your posts for a while, and it is pretty impressive that you are able to dig up these stats. I mean that is great and all but what can be done to actually improve high school graduation rates, and what can be done to reduce chronic absenteeism? I will be truly happy if solutions are really found to these problems other than just pointing them out.
There are many solutions to chronic absenteeism, including bus transportation, in-school laundry facilities, in-school health clinics, reminders to parents, alarm clocks for students, activities for students that they enjoy. But all these ideas require parents and school administrators to be consistently dealing with the issue and keeping it front and center in their planning.
If bullying is a reason for the higher rates of high school dropouts, then if something was actually done about the bullying problem, then I can bet anything more and more kids would be graduating from high school. There is awareness about bullying but it doesn’t seem to have made much of an impact. There are still plenty of problems with that.
My research does not indicate that bullying or harassment influences high school graduation rates despite news reports. It may be that does influence individual students but this research dealt with entire high school graduation rates and there may not be enough data to support that hypothesis.
I don’t know what the graduation rates were said, 50 years ago but my guess is that it has dropped mostly because kids these days give up if things get tough. They hate being challenged. Kids nowadays are babied and have not learned how to handle failure. That also comes from the belief that being firm with kids and not wanting to tell them ‘no’ is considered abuse! That is really scary because this means that generation will be taking over soon, and if coddled grown-up kids are making the rules, then that is bad news for the rest of us.
Thank you for your comments. Grit, the ability and drive to continue when faced with failure or difficulties, is an important concept that many educators are focusing on because of the reasons you mention.
Well, think about this. When I was in grade 1, that is when I was taught how to read. And now, 4-year-old preschoolers are expected to learn to read. What does this have to do with high schoolers dropping out right left and center? School work these days has gotten just way too hard and the expectations are higher than they used to be. It is really no wonder that so many kids are not staying in school and are settling to stock shelves or work at a burger joint for a living. If they had the same expectations of kids like they did over 30 years ago, I bet more kids would be staying in school and graduating.
It is true that our nation has raised the standards for high school graduation. Most states require two years of a high school math, algebra and geometry, two or three sciences plus English and Civics. However, lowering the standards will not make it easier to keep a job in the technology world in which we live.
You would think that graduation rates would be higher in affluent areas than in schools that are in poorer areas. Is there a way to verify that? I am sure the poorer areas bring the rates down.
Thank you for your comments. Students of all income groups are entitled to an education and high school diploma. It should not matter how rich or poor their parents are.
Teachers are to blame for some of this issue I believe. There are way too many stories about teachers not taking their students seriously, and many teachers are known to bully just as often as classmates do. A good-quality teacher will encourage kids to stay in school and I know this because some of my high school teachers have made a huge impact on me. If teachers are not encouraging to kids and if some are even mocking them, then it is no wonder this issue is not improving. Agree?
Yes, there is statistical evidence that a poor teacher is much worse in terms of educational progress than just an average teacher. It is very important that all teachers have the proper certificates to teach.
Adolescence is a difficult phase for anyone, and if they are not feeling supported or they are experiencing bullying as someone else had mentioned already, then they will bail. If they are not getting enough support and encouragement from outside sources then they won’t be motivated to stick around and finish up.
There are so many variables that influence the percentage of high school dropouts versus those who stay and graduate. What you had listed as being potential causes of the high dropout percentage such as bullying, and chronic absenteeism due to not taking school seriously and so on are probably big factors. But there must be other reasons as to why so many kids are dropping out. The problem will not be resolved unless all of the causes are tackled and not sure if that is going to be so easy.
Thank you for your comments. I wanted to develop a simple model with only a few variables so that schools could focus on the variables that influence high school graduation the most. i agree that there are many variables that cause students to drop out, and they should all be addressed. But in a world of limited resources figuring out the ones that could make the biggest difference is what I wanted to research.
I often wonder because of the fact that class sizes are larger for the most part nowadays if that is a huge factor. It is difficult to focus in large classrooms, and that even applies to anyone who does not have ADHD. Kids will get overwhelmed and quit altogether. So that is likely a major factor.
I’ve been following your content over the last year and you do great work with finding out stats that have to do with education in general. But really, if solutions for decreasing student absenteeism and high school dropouts were found and discussed, I’d be a lot more confident about the situation improving.
Thank you for your thoughts. Chronic absenteeism is a relatively new variable that educators are looking at. Three quarters of the state Every Student Succeeds Act include chronic absenteeism or attendance in their metrics to evaluate local districts and schools. It is something that educators will be paying attention to in the future.
With these dropout rates increasing every year in America, this is just a sign that there is very little hope for this country. I fear for this new generation because they are going to be facing plenty of anarchy down the road.
Thank you for your comments. Graduation rates have been increasing over time and they need to increase more. This research provides some ideas of how educators can increase them.
I have been dealing with insomnia for some time and I know that this is a common complaint that kids have as well. I admit whenever I go to bed later than my designated bedtime, I am going to be up all night. I am sure many kids have the same issue. Poor hygiene I bet anything is a cause for low graduation rates. Not for all of it but I think a lot of kids are affected.
I am stunned that Massachusetts did not have the highest high school graduation rate considering that very prestigious universities are in that region, and it seems like a higher-class state. You would think that with classier people living in the area and with those top notch colleges that the dropout rate would be a lot lower. Strange.
All states even Massachusetts have pockets of poverty and low performing schools. State graduation rates are based on high schools throughout the entire state, not just one area.
I can only imagine the rates are a lot worse in poor areas such as in East or West Harlem NY. Those places are full of crime and kids are learning from very bad examples. That is why it is still just as dangerous as ever.
There are a lot of kids with learning disabilities and disabilities that are not so obvious like ADHD and since they feel like they aren’t taken seriously a good portion of the time, this is likely a reason that they are dropping out of high school. If there was more help available for these kids, then the rates would be better. Just my thoughts. It is also the parent’s responsibilities to notice that their kids are struggling and to help them find a solution.
Thank you for your thoughts. Children with disabilities really do need help to graduate and fortunately we have laws to support them.
the US is definitely going down. It used to be a great country and it has lost its quality so it is no wonder that fewer kids are graduating from high school and are turning out to be bums. You don’t see this problem happening in Europe so much. They value their education and kids finish school and become active members of society. Not welfare bums.
Thank you for your comments. It is important to work towards having a national graduation rate of 90% as the models indicate that will improve the GDP significantly.
I bet in California hardly anyone is graduating high school. That state has gone down as it was once a nice place but not anymore.
California graduates 83.1% of its high school students. The national average is 84%. This is below the national average, but certainly not the worst in the nation. California still has many wonderful places to live and raise a family.
How many of these schools offer coop programs? Because that would be a good incentive for kids to stay in school and graduate. At least once these kids see that they will earn money and getting some real work experience, they will be motivated to stay.
Thank you for your suggestion. Many schools offer career and technical education which can help many students.
Kids have the right to drop out at 16 if I am
not mistaken. Sometimes they need to learn harsh lessons by facing the consequences if they dropout since the jobs they could get without a high school diploma are very limited. Eventually they’ll smarten up and take their GED so they can get more options.
Thank you for your thoughts. Some states have raised the age to drop-out. We should not be encouraging students to drop out and get a GED as an alternative. GED education has improved over the years, but is not the same as a standard high school diploma. The US Army does not accept all alternative high school options (GED is the most famous alternative high school diploma, but not the only one); however, the US Army does accept all high school diplomas and it is a requirement to have one to enlist.