The most important goal of the public K-12 education system is a high school diploma. However, the US adjusted cohort graduation rate is only 84.1%[1]. South Korea[2] and Finland[3] graduate 93% of their high school students, a more significant percentage of students.
This research looked at three different variables from the Department of Education Office for Civil Rights (OCR) bi-annual data and its correlation to high school graduation rates. The Every Student Succeeds Act (ESSA) has a new Fifth Indicator variable by which to evaluate and judge individual schools and districts, which is 20% of the total score. This Indicator is a non-academic variable as the other 80% of the school’s score reflects the school’s academics. Three quarters of the states choose chronic absenteeism or attendance as one of its metrics[4], and three quarters of the states also choose to measure career or college readiness, such as a minimum score on an SAT or ACT test or access to higher level, advanced courses. Three states, Connecticut, Vermont and Michigan for K-8 only[5], also include physical education as part of their Fifth Indicator and that is also examined.
The Data
The Department of Education graduation data provides Adjusted Cohort Graduation Rates (ACGR) for 23,090 high schools. The four year ACGR is the number of students who graduate in four years or less with a regular high school diploma divided by the number of students who formed the cohort for that graduating class, starting in 9th grade. However, to protect student privacy, if there are less than 5 students in the cohort, no data is provided and for cohorts less than 200, a range is given. The smaller the cohort the wider the range will be. When a range is given, this research assumed the average number of the range.
The Office for Civil Rights (OCR) data has 96,360 pre-schools, elementary, middle, high schools, juvenile justice, alternative, special education, and charter schools with 1,836 variable including bullying, teacher-student ratio, certification, absenteeism, sports participation, and more divided by gender, ethnicity, LEP, and 504 subsets.
Each dot on the charts represents a single high school’s graduation rate on the y axis and the chronic absenteeism, AP class participation rate or sports participation rate on the x axis. The solid line is the linear regression, and the national Adjusted R Squared value is at the top of each chart.
Chronic Absenteeism
Previous research has identified chronic absenteeism as highly correlated to lower academic achievement and graduation rates. The federal standard for chronic absenteeism in this data set is a student chronically absent for missing 15 school days in a school year. Many states have adopted a slightly different standard of missing 10% of the school year or 18 days in a typical 180 school year.
This research shows a negative correlation between high school graduation rates and chronic absenteeism. The downward slopping liner regression means that the higher the chronic absenteeism rate the lower the graduation rate. Although some regression lines are steeper than others, this negative relationship is true in every state in the Union.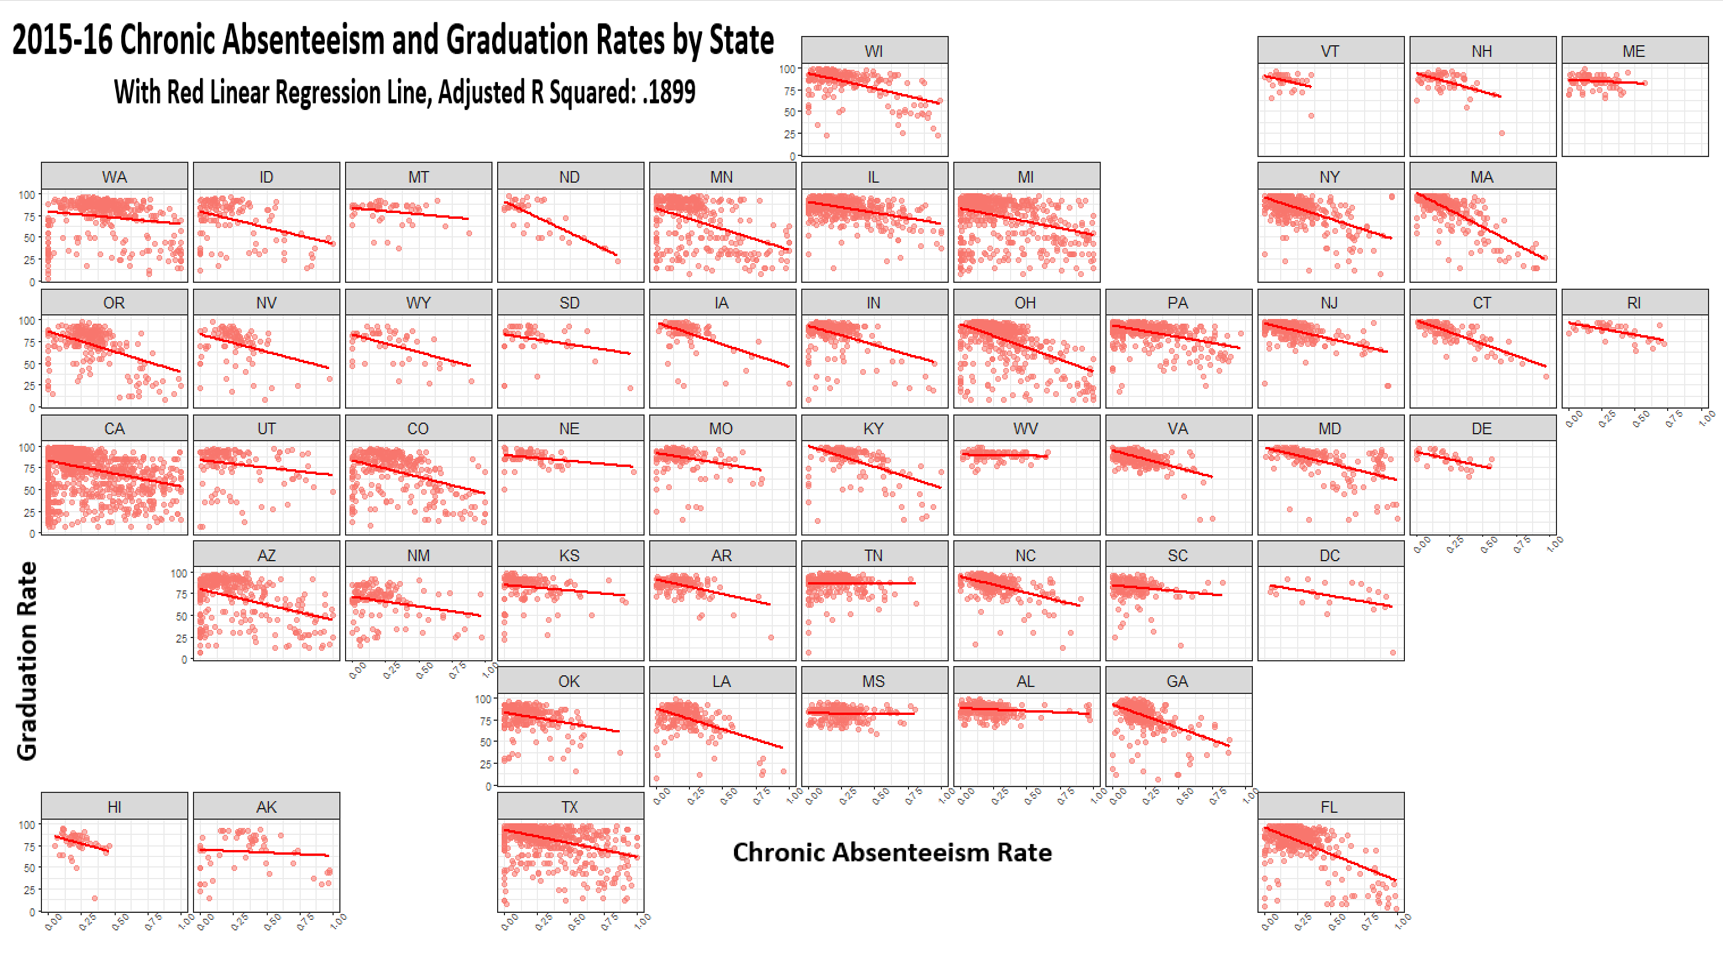
AP Class Participation Rate
Enrolling in a class in high school that represents the work and skills needed for an introductory college class has a positive relationship with graduation. This metric does not include whether a student took the AP exam, passed with the exam with 3 or higher, failed the exam, or if the AP class was in a science or math. This metric is only the percentage of students at the school that took at least one AP class. AP class participation positively influences higher graduation rates, and although a few states seem to have flat lines, the overall trend seems to be that it does make a difference towards greater high school graduation rates.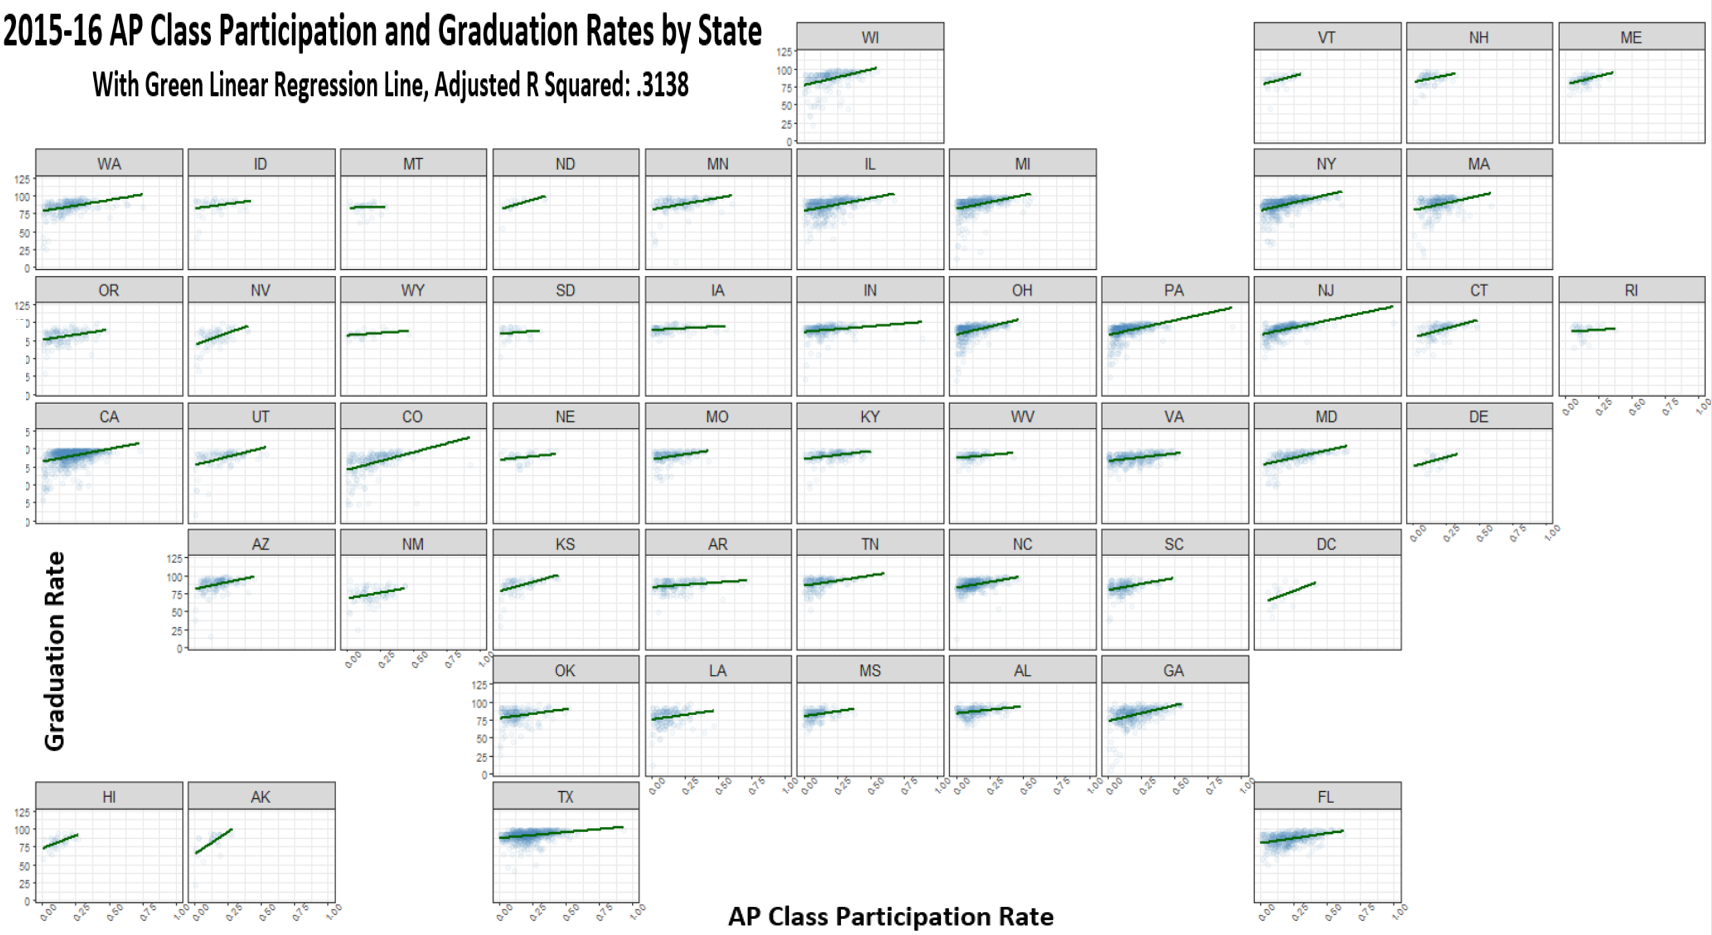
Sports Participation Rate
About a third of students participate in a high school sport and it also seems to have a positive influence on graduation rates. This seemed to be one of the more surprising relationships with graduation, but being part of high school sports team teaches many life lessons. Athletes are often an important representative of their school and community, generating pride in themselves. They develop teamwork and collaboration skills, learn the value of practice and self-discipline. It’s fun and enjoyable and in many states the right to be on a team requires daily attendance at school, acting as a brake on chronic absenteeism. Three states, District of Columbia, Montana and South Dakota did show a negative relationship, but those three states are smaller than average, so a few schools can have skew the results.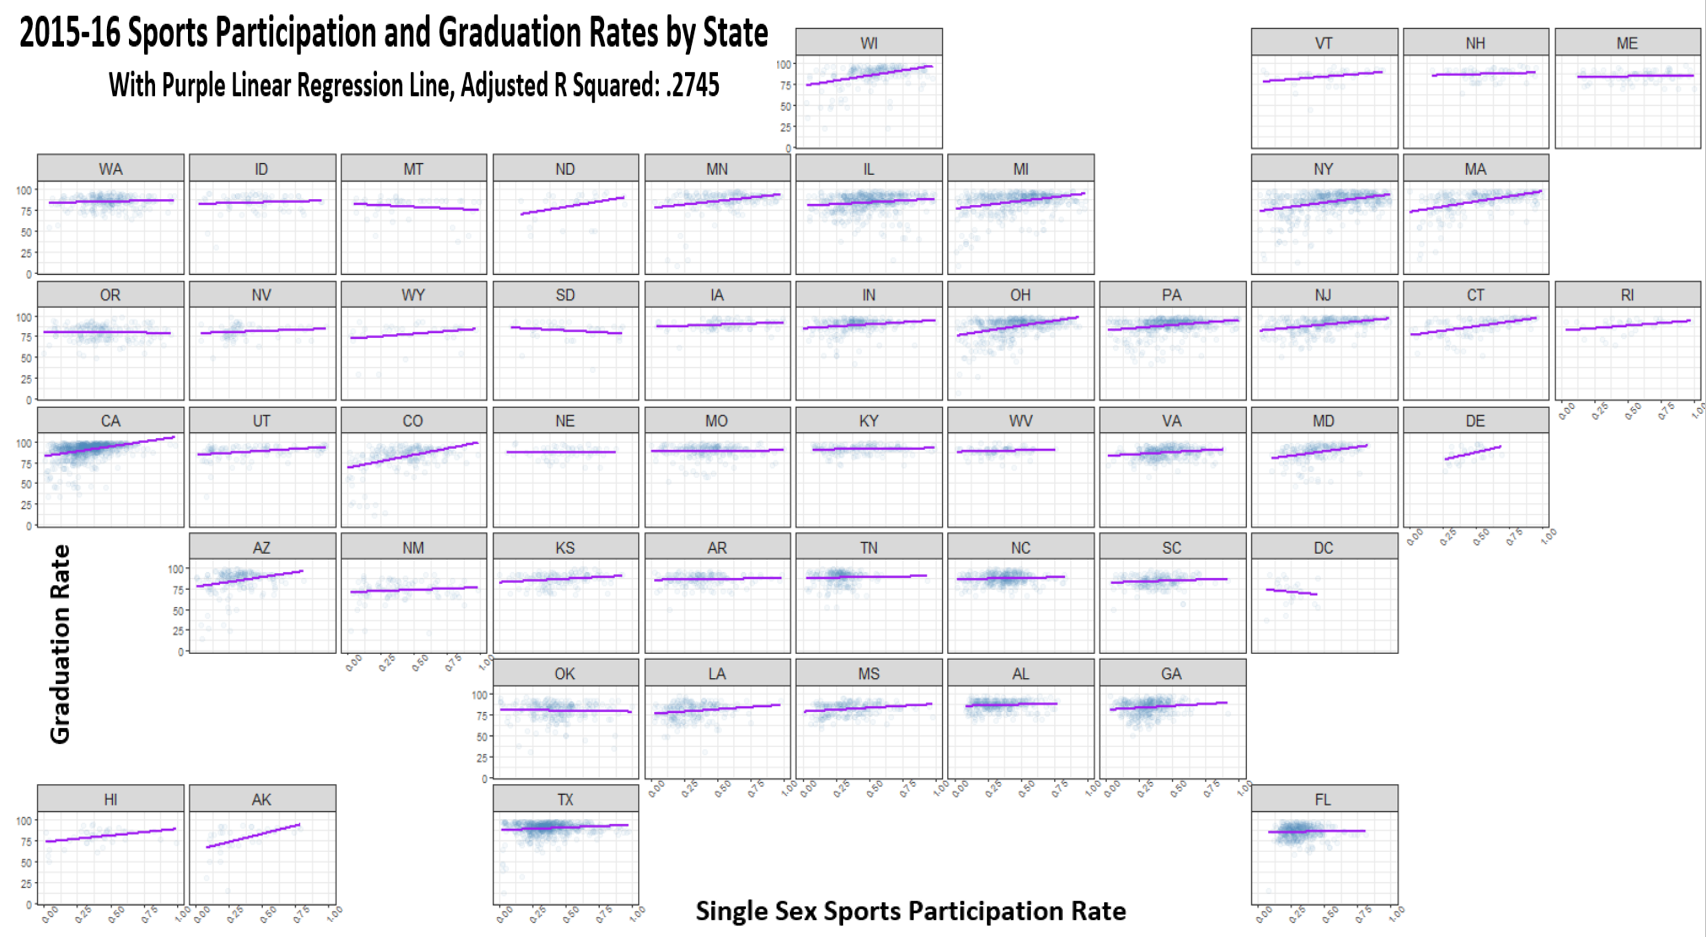
Links to the data:
https://www2.ed.gov/about/inits/ed/edfacts/data-files/acgr-sch-sy2013-14.csv
https://www2.ed.gov/about/inits/ed/edfacts/data-files/acgr-sch-sy2015-16.csv
https://www2.ed.gov/about/offices/list/ocr/docs/crdc-2013-14.html
https://www2.ed.gov/about/offices/list/ocr/docs/crdc-2015-16.html
Footnotes:
[1] http://www.americaspromise.org/
[2] https://abcnews.go.com/Business/story?id=6293334&page=1
[3] https://www.businessinsider.com/finland-education-school-2011-12#teachers-are-selected-from-the-top-10-of-graduates-19
[4] https://www.the74million.org/article/educators-hoped-essas-5th-indicator-would-paint-a-clearer-picture-of-student-success-but-with-some-states-now-choosing-up-to-11-different-measures-experts-worry-results-ar/
[5] https://www.the74million.org/article/educators-hoped-essas-5th-indicator-would-paint-a-clearer-picture-of-student-success-but-with-some-states-now-choosing-up-to-11-different-measures-experts-worry-results-ar/
I have to say it is not a shock to learn that the high school graduation rates in South Korea and in Finland are higher than the US. Education is really emphasized in these countries, and that makes a huge difference. I have heard that there are also some funding for colleges in Finland, and I wonder if that in itself encourages more kids to graduate from high school. Have you heard of this being true?
You are correct that there are very significant financial incentives for higher education students in Finland, including grants, loans and a housing allowance. The only requirements seems to a full-time student and making progress academically. For some students that would be a very attractive incentive to continue to study.
This is a sad thing to read because here in Canada, the graduation rates a lot higher than it appears to be in the US. Is it worse in some US states than others? I would imagine so as well. Since the high school graduation rate is higher in Canada, what can the US high school boards learn from the Canadian school boards?
Graduation rates in the US range from 91% (Iowa) to 71% (New Mexico). Canadian high school graduation rates are based on slightly older students (19 years). I will look for data about differences in US and Canadian high schools.
I also know that colleges in the Scandinavian countries are subsidized and the graduation rates are higher probably due to that. I think a huge reason that kids drop out of school is because they don’t have the money to go to college, and they don’t want to take out loans and to pay off debt during the rest of their adult lives. What do you think?
I agree that the ability to go to college because of money, time, travel, etc. holds many students back, I do not think it is the reason most students drop out. I think weak students hit a bump in the road and there are many of them and dropping out seems easier than dealing with whatever problem they are facing. I wish we as a country devoted more time, energy and funds to supporting students at all levels of education.
I personally would not take these figures too seriously. This could all change in a year from now. Doesn’t the graduation rate fluctuate every year?
Yes, the graduation rate changes year to year, but because graduation is a reflection of 12 years of education, or more if you count kindergarten, they do not fluctuate dramatically year to year.
Hmm. I wonder if the rate is higher nowadays because of the fact that students are required to volunteer to non-profit organizations as Autism Speaks for a number of hours in order to graduate from high school. And, students really don’t want to volunteer their time and may find this a deterrent from finishing school. Do you think this may play a role in this issue?
Thank you for your comments. I am not sure how volunteering might negatively affect graduation rates. Most schools allow a wide variety of volunteer choices, not just one. I will have to check out that idea.
That is quite impressive that you are able to collect all of this data on the high school graduation rates. And it is also great that you are taking the time to write your findings out in such detail. Hopefully, the school boards across the country will take these values seriously and start implementing some changes to help encourage kids to stay in school and to graduate.
Thank you for your thoughts and support.
These findings are quite discouraging, but I am sure the graduation rates are much higher in North America in general than it would be in South America and in many African countries. What are your thoughts?
According to this data from the OCED, one country in South America does have a higher graduation rate than the US, Chile. (https://data.oecd.org/eduatt/graduation-rate.htm) Other countries that are higher than the US include the UK, Australia, France, Spain, Israel, Canada, and Poland.
Not a surprise really considering plenty of kids are still playing hooky and skipping school so they get immediate gratification. They don’t consider the consequences that they’ll face later on when they try to apply for jobs and are rejected because they don’t have a high school diploma. Then our tax dollars have to support those who dropped out of school because they can’t get a job that pays more than minimum wage.
Yes, I agree that playing hooky in high school leads to poor work habits during adulthood. It is something that wise high school staff remind students of regularly.
It appears that the high school graduation in New England is pretty high compared to many of the other states. Why do you think that is? I mean you have the top universities in those regions as well so it may be that education importance is important based on the culture in New England. That is my guess.
Thank you for your thoughts. Research has shown that parent engagement and support for schools and education does influence students to continue and work harder.
Parents nowadays are not overly tough on their kids and the same applies to society in general. Kids can’t cope if they fail and were never prepared to face failure either. So they just give up and don’t receive encouragement by their parents or any authority figure in general to keep trying. I’m sure this plays a factor as well.
Thank you for your comments.
California seems to have one of the lowest graduation rates if I am looking at this correctly. I often wonder if the importance of education is not stressed enough in the western US as it is more so in the eastern part of the country?
California’s graduation rate at 83% is less than the national average at 84.1%. However, New Mexico, Nevada and Oregon have the lowest graduation rates at less than 75%.
I think there are plenty of 16-year-olds that are legally able to leave home even though they are minors play a significant role in this. They drop out of school and are old enough to work, so they take menial jobs that don’t require a high school diploma so they can make enough money to live on their own. And they don’t think about how this could hurt them in the future, because all they want is their independence now. That could be a possible factor in the low rates. My thoughts only.
Yes, 16 year old students in some states can drop out; however, as minors their parents must approve them dropping out. Society and schools must emphasize the reasons why this is a poor choice and parents must back them up.
Perhaps if schools offered kids activities that were more appealing to them as well, that could maybe reduce the rate of high school dropouts. There just has to be some solution to improve the situation! I cannot imagine otherwise. They haven’t looked into ways that carefully for how they could encourage kids to stay in school.
Schools do offer many activities to engage students. There is most likely not a silver bullet or one simple solution to this problem. Instead it requires a multi-year, multi-pronged approach. It can be done, but it takes a lot of work, energy and financial commitment from schools and the local, state and federal authorities.
Why do I believe that the high school graduation rate was higher in every state 20 years ago? That’s because nowadays so many kids believe that they are entitled and have been coddled. If something gets a little difficult then they give up.
Thank you for your thoughts. Over the years, states have raised the standards for graduation and that may make it more difficult for weak students to receive a diploma.
I think because not enough has been done to prevent high school bullying despite the awareness going around, this is a huge reason that so many kids are dropping out. I was bullied in high school and I had thoughts about quitting so many times. I stuck it out but I am psychologically damaged from it and this happened 30 years ago. With social media in the picture nowadays, it is even worse for victims today.
Thank you for your thoughts. I am sorry that you were a victim of bullying and it still haunts you. Bullying and harassment are now a tracked metric in all public schools as this is such an important issue. Hopefully for current and future students it will not so hard on students and victims.