Our nation graduates only 84.1% of its high school students and that is too low for a nation that wants to advance economically and technologically. The US releases graduation data for every year, but only collects and releases data from the Department of Education Office for Civil Rights every other year (2015-16 is the latest year) which includes interesting data like the number students that studied biology, chemistry, physics, algebra or geometry, enrolled in an AP class, took the SAT or ACT test, participate in high school sports, reported being bullied or harassed, number of teachers that are chronically absent or lack a teaching certificate, students that are chronically absent or receive in-school suspensions, out-of-school suspensions, expulsions, and most of this data is then broken down by gender, ethnic group, and disability status.
The Every Student Succeeds Act (ESSA) has a new Fifth Indicator variable by which to evaluate and judge individual schools and districts, which is 20% of the total score. This Indicator is a non-academic variable as the other 80% of the school’s score reflects the school’s academic results. The Fifth Indicator is supposed to be a metric that includes all students and reflects “school quality” or “student success.” Each state chose a different combination of variables. This research choose to look at some of these Fifth Indicator variables to see if they influence graduation, the most important goal of K-12 education.
The Data
The Department of Education graduation data provides Adjusted Cohort Graduation Rates (ACGR) for 23,090 high schools. The Office for Civil Rights (OCR) data has 96,360 pre-schools, elementary, middle, high schools, juvenile justice, alternative, special education, and charter schools with 1,836 variable including bullying, teacher-student ratio, certification, absenteeism, sports participation, and more divided by gender, ethnicity, LEP, and 504 subsets.
Enrollment
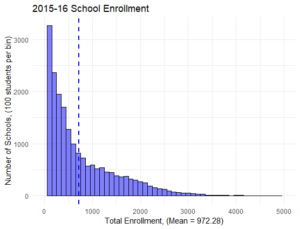
A quick look at high school enrollment shows that the mean high school enrollment has less than 1,000 students and that the largest number of schools enroll the smallest number of students. Each bar in the chart represents 100 students, and there are about 1,300 high schools with 100 or fewer students. The most significant thing to consider about very small high schools is that they have small staffs and most likely do not have the range of subjects or advanced classes that would be available at a larger high school.
AP Class Participation
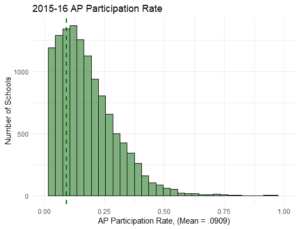
The OCR data tracks how many students take one or more AP classes, plus the number that take AP classes in chemistry, physics, math, and other subjects, which student take the AP exam, pass with a 3 or higher, and how many fail the AP exam, broken down by gender, ethnicity and disability. The mean enrollment rate for taking at least one AP class is 9%. AP classes do involve more obligations. Both parents and students must be committed to the additional studies necessary to enroll in an advanced class that is similar to a college introductory class. Principals and school superintendents have to hire teachers that can teach college level curriculum and there must be enough students who have completed the lower level math, science and language arts to fill an advanced class.
Sports Participation
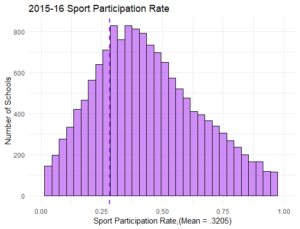
The OCR also tracks how many students participate in a high school sport. It is more than three times the number that enroll in an AP class. Of course, being a coach of sports team does not require a teaching certification. Many former high school sports stars coach high school teams to stay involved with the sport and for enjoyment.
Next Blog
The next blog post will examine the relationship between some of these variables and graduation rates.
Links to the data:
https://www2.ed.gov/about/inits/ed/edfacts/data-files/acgr-sch-sy2013-14.csv
https://www2.ed.gov/about/inits/ed/edfacts/data-files/acgr-sch-sy2015-16.csv
https://www2.ed.gov/about/offices/list/ocr/docs/crdc-2013-14.html
https://www2.ed.gov/about/offices/list/ocr/docs/crdc-2015-16.html
I completely agree that if only 84.1% of high school students are graduating, then that is not enough to help keep the economy flowing. Too many dropouts do drain the system. So what can really be done to convince students to stay in school, and to graduate? I also think that a lot of students are suffering from low self-esteem because they don’t think they can do anything great. So, they drop out. How can this issue be fixed?
Fixing the issue is a complicated problem involving school administration, teachers and parents. In my next post, I show some variables that have a correlation with graduation, chronic absenteeism (negative) and AP class participation and Sports participation (both positive). There are some ways to change things but it does take time, money and energy to make it happen.
This is quite sad, and not surprising really. What angers me the most is that high schools don’t have enough suitable programs for teens with autism and other special needs. Many of these individuals can contribute a lot to society if they are taught the way they can learn. Until they fix that issue, many of these people will not be able to contribute and will end up needing help from taxpayers.
Many schools have special programs for students with autism and other spectrum disorders. Many of the people with autism and spectrum disorders can be useful, productive members of society, but they do need special help. That help pays off in the end as those individuals can live independently.
This actually surprises me and I have a hard time believing that the high school graduation rates are as low as they are. I thought nowadays with education being so focused that more students would be finishing up high school. Sure, there are always going to be dropouts. But I just have a hard time believing that so many kids really are not finishing high school. It just does not seem to make sense.
It is sad, but drop-outs are not evenly spaced throughout the country. About 2,000 high schools out of more than 20,000 graduate less than 60% of their students. The rest are drop-outs and those high schools account for more than 50% of the drop-outs. (https://www.dosomething.org/us/facts/11-facts-about-high-school-dropout-rates) The good news is that if we focused on those 2,000 high schools we could significantly improve the graduation rate.
I am sorry but I think this must be wrong. I am quite sure that I heard from elsewhere that the high school graduation rate in the USA was over 90%. Especially since most students do want to go to college, university, or to some trade school. So that is making me wonder where do you get your stats from? I don’t believe that this is correct at all.
Two states, Iowa and New Jersey have graduation rates more than 90%. Many individual high schools have rates over 90%, but not the nation in whole. Here is a link to state by state graduation rates: http://gradnation.americaspromise.org/
Thanks for sharing these statistics as I am sure this was not easy to figure out. I hope that now that you found these percentages and figures that education boards can figure out ways to encourage kids to stay in school and to graduate so they can land good jobs in the end. You cannot really get a decent job nowadays if you don’t have any kind of post-secondary education.
Yes, I also hope school educators and administrators also look at these figures and act on them.
I would have also believed that some states have higher graduation rates than the others. I would have thought that the northern states would have much higher rates than the southern states. My belief is that parents and school boards in the northern states seem to place a larger importance on education. Am I wrong about that?
Yes, graduation rates vary by state, some are high (Iowa and New Jersey are both more than 90%) and some are low (New Mexico, Nevada and Oregon are all less than 75%). There does not seem to be a noticeable geographic trend to graduation or chronic absenteeism.
My personal take on this is that schools should not force kids to take courses that they clearly are not good at. I mean, they need to offer more electives to replace the courses that the students cannot take but are forced to take. I mean, for instance, if a student is not good at math, then he or she should not have to be forced to take math and offer courses that he or she can easily do. That also means these students should be encouraged to look into fields that they will like and can do.
Thank you for your thoughts. However, the purpose of a high school diploma is so that a student is ready for the next stage in life whether that is college, career or the military. Students that have very little math will not be prepared for any of those. In this modern age, even an assistant manager at a fast food restaurant is responsible for closing out the cash register (math skills), cleaning up messes (chemistry) and dealing with sticky personal issues which involve good communication skills. Many electives would leave a student without enough skills for a good job in our economy.
lWhat schools need to do is prepare kids for the real world much better than they do. Are there courses that are available to high school students that will teach them about finances and anything else that will teach them about life? Because students would do better with courses like that instead of strictly academic. Not every student is going to be ‘book smart’ per se and would get a lot more out of courses that teach them about real life. My 2 c.
After the 2008 Great Recession, some states, including my state Virginia, added a high school requirement to study personal finance and financial literacy. It is a pretty basic course, but it does give student a foundation in understanding how to balance a checkbook, what mortgages mean, etc. It certainly would be good for every high school student to be exposed to this topic.
Wow. This really makes you open your eyes to see that the school boards are still failing kids if the dropout rate is so high. I believe that the biggest reason that kids drop out of school is due to bullying. And, it seems to me that even with the bullying awareness going on, not much has changed. How sad.
Bullying is certainly a reason that some students do not attend school. I have looked at a number of variables in this data set and bullying and harassment is one of them. However, it is not correlated with graduation rates at all, meaning one cannot assume that there is a positive or negative relationship between bullying and graduation rates. I assume the reason is that there are not enough reports of bullying and harassment to influence the data.
These stats are somewhat discouraging because it is a sure indication that the school boards are messing up on something which would cause the high school dropout rate to be high. Has it gotten worse over time?
The reported graduation rates have improved over time. However, the graduation rate is more complicated and leads to states and districts “gaming it” for political reasons, community pride, etc. according to this piece from the Brookings Institute (https://www.brookings.edu/research/is-the-high-school-graduation-rate-really-going-up/).
I was told about this blog post by a fellow high school teacher, and I personally have found that students that are encouraged to participate in sports, art clubs, and other activities are more confident, and are more likely to graduate. They are less likely to be bullied as well. I think that students need to be encouraged to participate in school activities, as well as extracurricular activities.
Yes. I totally agree. In my next post, I show research that shows a positive relationship between participating in high school sports and graduation rates.